
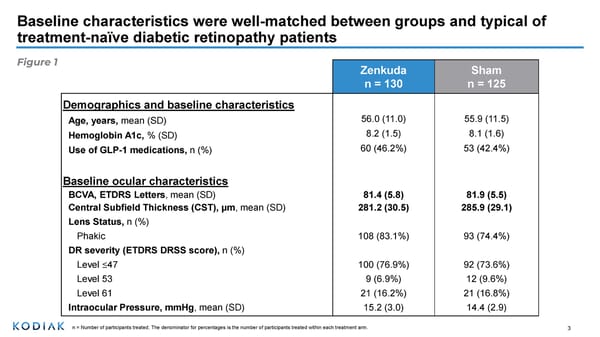
Zenkuda n = 130 Sham n = 125 Demographics and baseline characteristics Age, years, mean (SD) 56.0 (11.0) 55.9 (11.5) Hemoglobin A1c, % (SD) 8.2 (1.5) 8.1 (1.6) Use of GLP-1 medications, n (%) 60 (46.2%) 53 (42.4%) Baseline ocular characteristics BCVA, ETDRS Letters , mean (SD) 81.4 (5.8) 81.9 (5.5) Central Subfield Thickness (CST), μm , mean (SD) 281.2 (30.5) 285.9 (29.1) Lens Status, n (%) Phakic 108 (83.1%) 93 (74.4%) DR severity (ETDRS DRSS score), n (%) Level ≤ 47 100 (76.9%) 92 (73.6%) Level 53 9 (6.9%) 12 (9.6%) Level 61 21 (16.2%) 21 (16.8%) Intraocular Pressure, mmHg , mean (SD) 15.2 (3.0) 14.4 (2.9) Baseline characteristics were well-matched between groups and typical of treatment-naïve diabetic retinopathy patients n = Number of participants treated; The denominator for percentages is the number of participants treated within each treatment arm. 3 Figure 1
 Phase 3 Study Outcomes in Diabetic Retinopathy Page 2 Page 4