
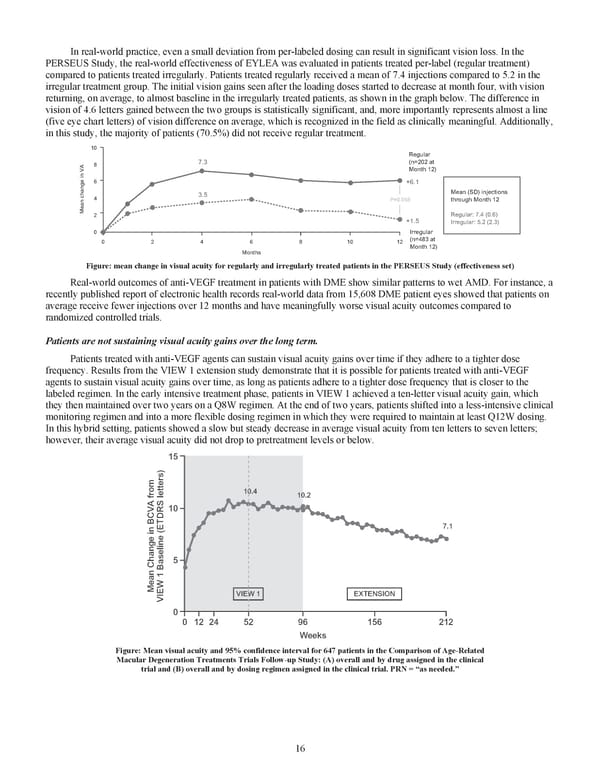
16 In real-world practice, even a small deviation from per-labeled dosing can result in significant vision loss. In the PERSEUS Study, the real-world effectiveness of EYLEA was evaluated in patients treated per-label (regular treatment) compared to patients treated irregularly. Patients treated regularly received a mean of 7.4 injections compared to 5.2 in the irregular treatment group. The initial vision gains seen after the loading doses started to decrease at month four, with vision returning, on average, to almost baseline in the irregularly treated patients, as shown in the graph below. The difference in vision of 4.6 letters gained between the two groups is statistically significant, and, more importantly represents almost a line (five eye chart letters) of vision difference on average, which is recognized in the field as clinically meaningful. Additionally, in this study, the majority of patients (70.5%) did not receive regular treatment. Figure: mean change in visual acuity for regularly and irregularly treated patients in the PERSEUS Study (effectiveness set) Real-world outcomes of anti-VEGF treatment in patients with DME show similar patterns to wet AMD. For instance, a recently published report of electronic health records real-world data from 15,608 DME patient eyes showed that patients on average receive fewer injections over 12 months and have meaningfully worse visual acuity outcomes compared to randomized controlled trials. Patients are not sustaining visual acuity gains over the long term. Patients treated with anti-VEGF agents can sustain visual acuity gains over time if they adhere to a tighter dose frequency. Results from the VIEW 1 extension study demonstrate that it is possible for patients treated with anti-VEGF agents to sustain visual acuity gains over time, as long as patients adhere to a tighter dose frequency that is closer to the labeled regimen. In the early intensive treatment phase, patients in VIEW 1 achieved a ten-letter visual acuity gain, which they then maintained over two years on a Q8W regimen. At the end of two years, patients shifted into a less-intensive clinical monitoring regimen and into a more flexible dosing regimen in which they were required to maintain at least Q12W dosing. In this hybrid setting, patients showed a slow but steady decrease in average visual acuity from ten letters to seven letters; however, their average visual acuity did not drop to pretreatment levels or below. Figure: Mean visual acuity and 95% confidence interval for 647 patients in the Comparison of Age-Related Macular Degeneration Treatments Trials Follow-up Study: (A) overall and by drug assigned in the clinical trial and (B) overall and by dosing regimen assigned in the clinical trial. PRN = “as needed.” 0 2 4 6 8 10 12 Regular (n=202 at Month 12) Irregular (n=483 at Month 12) Mean (SD) injections through Month 12 Regular: 7.4 (0.6) Irregular: 5.2 (2.3) P=0.008 7.3 3.5 +1.5 +6.1 10 6 4 8 2 0 Months Mean change in VA 0 12 24 52 96 156 212 10.4 0.2 10 7.1 15 10 5 0 Weeks Mean Change in BCVA from VIEW 1 Baseline (ETDRS letters) VIEW 1 EXTENSION
 Kodiak 2018 Annual Report Page 27 Page 29