
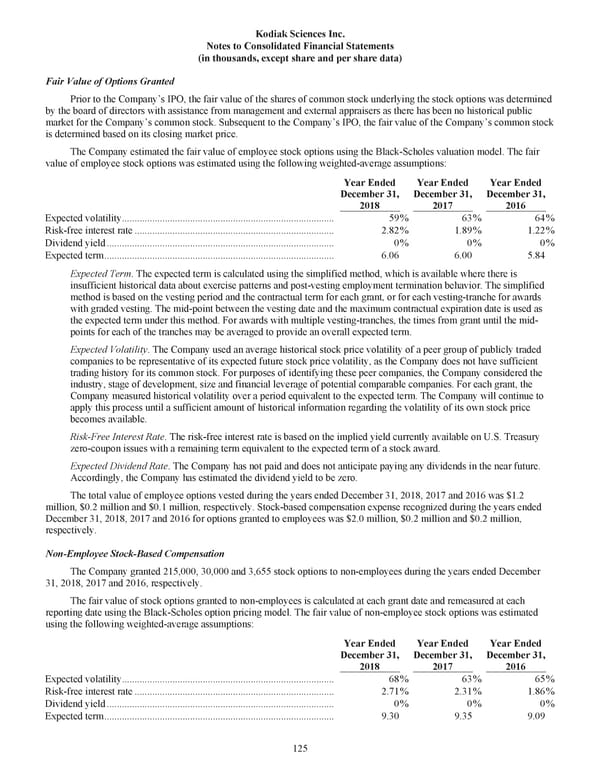
Kodiak Sciences Inc. Notes to Consolidated Financial Statements (in thousands, except share and per share data) 125 Fair Value of Options Granted Prior to the Company’s IPO, the fair value of the shares of common stock underlying the stock options was determined by the board of directors with assistance from management and external appraisers as there has been no historical public market for the Company’s common stock. Subsequent to the Company’s IPO, the fair value of the Company’s common stock is determined based on its closing market price. The Company estimated the fair value of employee stock options using the Black-Scholes valuation model. The fair value of employee stock options was estimated using the following weighted-average assumptions: Year Ended December 31, 2018 Year Ended December 31, 2017 Year Ended December 31, 2016 Expected volatility.................................................................................... 59% 63% 64% Risk-free interest rate ............................................................................... 2.82% 1.89% 1.22% Dividend yield.......................................................................................... 0% 0% 0% Expected term........................................................................................... 6.06 6.00 5.84 Expected Term. The expected term is calculated using the simplified method, which is available where there is insufficient historical data about exercise patterns and post-vesting employment termination behavior. The simplified method is based on the vesting period and the contractual term for each grant, or for each vesting-tranche for awards with graded vesting. The mid-point between the vesting date and the maximum contractual expiration date is used as the expected term under this method. For awards with multiple vesting-tranches, the times from grant until the mid- points for each of the tranches may be averaged to provide an overall expected term. Expected Volatility. The Company used an average historical stock price volatility of a peer group of publicly traded companies to be representative of its expected future stock price volatility, as the Company does not have sufficient trading history for its common stock. For purposes of identifying these peer companies, the Company considered the industry, stage of development, size and financial leverage of potential comparable companies. For each grant, the Company measured historical volatility over a period equivalent to the expected term. The Company will continue to apply this process until a sufficient amount of historical information regarding the volatility of its own stock price becomes available. Risk-Free Interest Rate. The risk-free interest rate is based on the implied yield currently available on U.S. Treasury zero-coupon issues with a remaining term equivalent to the expected term of a stock award. Expected Dividend Rate. The Company has not paid and does not anticipate paying any dividends in the near future. Accordingly, the Company has estimated the dividend yield to be zero. The total value of employee options vested during the years ended December 31, 2018, 2017 and 2016 was $1.2 million, $0.2 million and $0.1 million, respectively. Stock-based compensation expense recognized during the years ended December 31, 2018, 2017 and 2016 for options granted to employees was $2.0 million, $0.2 million and $0.2 million, respectively. Non-Employee Stock-Based Compensation The Company granted 215,000, 30,000 and 3,655 stock options to non-employees during the years ended December 31, 2018, 2017 and 2016, respectively. The fair value of stock options granted to non-employees is calculated at each grant date and remeasured at each reporting date using the Black-Scholes option pricing model. The fair value of non-employee stock options was estimated using the following weighted-average assumptions: Year Ended December 31, 2018 Year Ended December 31, 2017 Year Ended December 31, 2016 Expected volatility.................................................................................... 68% 63% 65% Risk-free interest rate ............................................................................... 2.71% 2.31% 1.86% Dividend yield.......................................................................................... 0% 0% 0% Expected term........................................................................................... 9.30 9.35 9.09
 Kodiak 2018 Annual Report Page 136 Page 138