
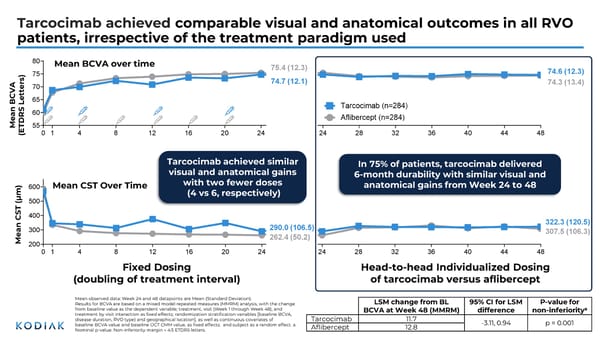
Tarcocimab achieved comparable visual and anatomical outcomes in all RVO patients, irrespective of the treatment paradigm used Mean observed data; Week 24 and 48 datapoints are Mean (Standard Deviation). Results for BCVA are based on a mixed model repeated measures (MMRM) analysis, with the change from baseline value as the dependent variable; treatment, visit (Week 1 through Week 48), and treatment by visit interaction as fixed effects; randomization stratification variables [baseline BCVA, disease duration, RVO type) and geographical location], as well as continuous covariates of baseline BCVA value and baseline OCT CMM value, as fixed effects; and subject as a random effect. a. Nominal p-value. Non-inferiority margin = 4.5 ETDRS letters. 74.6 (12.3) 74.3 (13.4) 322.3 (120.5) 307.5 (106.3) 24 28 32 36 40 44 48 24 28 32 36 40 44 48 290.0 (106.5) 262.4 (50.2) 74.7 (12.1) 75.4 (12.3) 0 4 8 12 16 20 24 55 60 65 70 75 80 1 0 4 8 12 16 20 24 200 300 400 500 600 1 Mean CST Over Time Mean BCVA over time Mean BCVA (ETDRS Letters) Mean CST (μm) Head-to-head Individualized Dosing of tarcocimab versus aflibercept Fixed Dosing (doubling of treatment interval) 32 In 75% of patients, tarcocimab delivered 6-month durability with similar visual and anatomical gains from Week 24 to 48 LSM change from BL BCVA at Week 48 (MMRM) 95% CI for LSM difference P-value for non-inferiority a Tarcocimab 11.7 -3.11, 0.94 p = 0.001 Aflibercept 12.8 Tarcocimab achieved similar visual and anatomical gains with two fewer doses (4 vs 6, respectively)
 J.P. Morgan Healthcare Conference 2026 Page 31 Page 33